Every company knows its gross margin. Almost none knows its real margin per order. Between the two sits a series of deductions — discounts, volume rebates, bonuses, payment terms, freight allowances — and somewhere in that series money leaks away that no one consciously gave up. That is margin leakage.
The subject is no management fad. The underlying insights are more than thirty years old and well founded. What is new is that a growing industrial company can now apply them to its own transaction data — without the pricing department of a multinational. This article explains what leakage actually is, why it stays so stubbornly invisible, and how to approach it seriously. And it ends with what you can already see for yourself.
- Margin leakage is not the discount you consciously give — it is the unintended gap between the price your policy prescribes and what actually remains on your invoice.
- In comparable industrial B2B companies we find structurally 2 to 5% of revenue in leakage — on €30 million in revenue that is €600,000 to €1.5 million per year, recurring.
- You measure leakage against your policy, not against an average. Measuring and deciding are two separate steps.
- You don't have to wait for an audit to recognise the first traces yourself — though seeing that something is there is still different from knowing how much.
What margin leakage actually is
Margin leakage is the difference between the price you should realise according to your own policy and what effectively remains after all discounts and agreements. So it is not the discount you consciously grant — that is a commercial choice. Leakage is the part that flows away without anyone consciously choosing it.
That distinction determines where you have to look. A deliberate volume discount to a large customer is not a leak — that is policy. A price that was lowered three years ago for a reason that no longer exists, and has stayed low ever since: that is a leak. The treacherous thing is that both look identical in your system. Leakage hides in patterns that seem defensible one by one:
- The discount that has stayed in place for historical reasons, even though the reason is gone.
- The price that was never adjusted after a cost increase — especially for loyal, long-standing customers.
- The agreement or label that isn't watertight in the system, and therefore has to be corrected manually every time.
- The same customer paying different prices for the same product, with no rule behind it.
None of those patterns is the result of a bad decision. They are the result of no decision — of dozens of small concessions that each made sense on their own and together eat a margin that no one ever meant to give away.
The pocket price waterfall: from list price to what really remains
To find leakage, you have to be able to follow the path from your list price down to your actual price — step by step. The discipline calls that descent the pocket price waterfall, a decomposition McKinsey introduced in the Harvard Business Review in 1992 and which has formed the basis of almost all serious pricing practice ever since.1
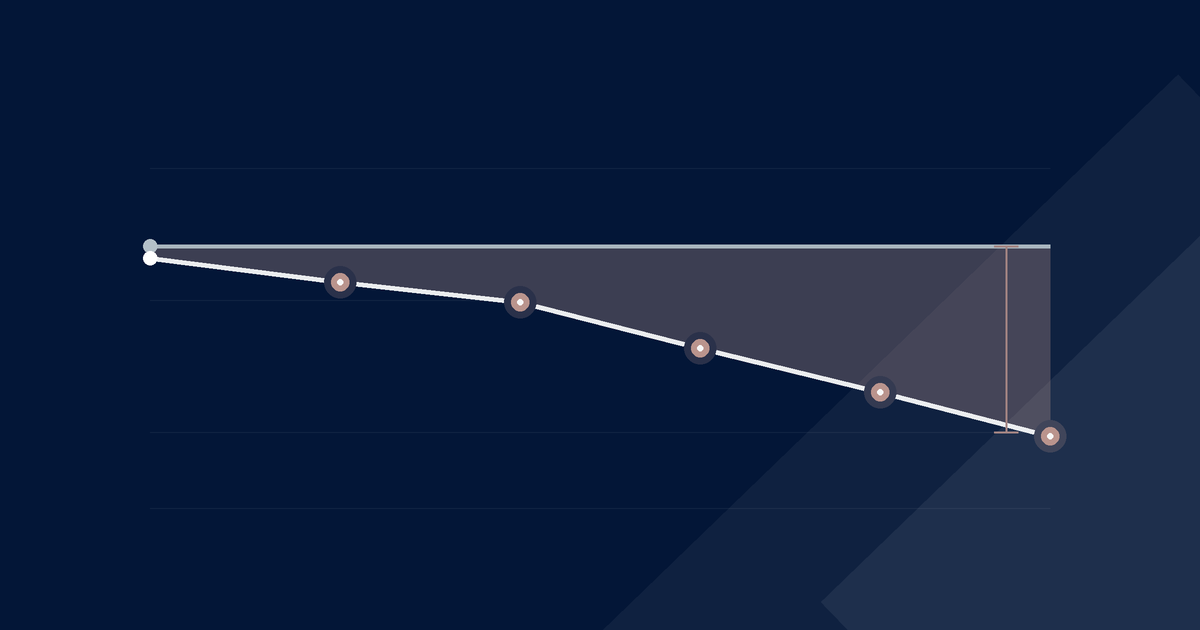
The waterfall has three levels. You start at the list price. From it you subtract the visible discounts — the volume tier, the negotiated discount — and you arrive at the invoice price: what appears on the document. But beneath that sits a second layer that is not on the invoice: payment discounts, the cost of deferred payment, promotional allowances, rebates paid out afterwards, a freight cost you quietly absorb. What remains after that is the pocket price — the money that actually lands in the bank.
“Leakage is not the discount you consciously give. It is the difference between your policy and your invoices.”
Robbie Eyckmans — Founder, YggraThat second piece, the so-called off-invoice erosion, is the most dangerous. Precisely because it isn't on the invoice, your commercial team doesn't see it: the salesperson negotiates on the invoice price, while the real margin is set one level deeper. Whoever looks only at invoice discounts therefore misses, by definition, half the story.5
Axis 1 — Visible erosion versus the invisible part
Part of those deductions you know about. Those are the discounts you consciously allow: visible erosion. Leakage is the part that leaks on top of that, without anyone deliberately turning the dial. It only becomes visible once you reconstruct the real price per order — invoice and order line by invoice and order line.
The scale surprises almost every management team. In its Global Pricing Study, Simon-Kucher found that companies realise on average only a fraction of their planned price increases; whoever announces ten percent often ends up keeping barely a quarter of it in practice.2
The reason those amounts matter so much is the leverage of price. McKinsey calculated that, for the average company, a one percent higher price at equal volume lifts operating profit by roughly eleven percent — and that arithmetic works relentlessly in both directions.1 One percent of margin that leaks away leaks through to your bottom line with a factor of ten. That is why leakage of “just a few percent” of revenue is often a double-digit share of your EBITDA.
Axis 2 — Measuring and deciding are two separate steps
Here our approach deliberately departs from the norm. Most analyses measure price deviation against an average. We measure against your policy — the price you intended to realise. Measuring against an average only tells you who sits below the peloton; measuring against policy tells you who sits below your intention. That makes leakage objective: every deviation from what you meant is measurable.
Crucially, measuring and deciding are two separate steps. Measuring is descriptive and judgment-free: you quantify every deviation. Deciding is normative: only afterwards do you determine, together with your leadership, what each deviation means. You must never conflate the two — a principle that both the academic literature and leading practice endorse.3 There are three possible outcomes for each deviation:
- Repair — pure loss (a forgotten indexation, an unauthorised discount). This you recover.
- Deliberately keep — a low price you strategically want (an anchor customer, a conscious choice). Not a leak, but now an explicit decision instead of an accident.
- Provisionally accept — contractually fixed until the next negotiation. Visible, with a timeline.
That is why dispersion in itself is not yet a problem. That the same part sells for more to one customer than to another is only a leak if you cannot explain the difference. A volume-based tier discount is legitimate structural policy, not leakage.6 The sharpest signal, then, is not the dispersion itself, but the gap between the discount actually applied and the authorised discount — and, more broadly, the residual price difference that remains after you have normalised for legitimate factors such as volume, segment and genuine service. The standard better practice uses is simple: price differences you can clearly explain and defend are not a leak; the rest is.3
If that policy does not yet exist explicitly — often the case in a growing company — we reconstruct it from your list prices, tier structure and commercial intent. That reconstruction is itself a first tangible result: your implicit policy, made explicit and testable for the first time.
Axis 3 — Price is not the same as cost-to-serve
The third axis protects you from the most expensive mistake: “repairing” a customer where the problem lies elsewhere. A customer can be unprofitable without anything being wrong with the price — sometimes the erosion sits in the cost of serving that customer: small deliveries, frequent visits, rush transport, intensive support, returns handling.
That distinction is classic and well documented. Customer profitability analysis — known from Kaplan and Narayanan's “whale curve” — shows time and again that a small share of customers carries the lion's share of profit, while a tail of customers destroys it.4
The largest customers by volume sometimes sit right in the loss-making tail. High revenue is no proof of profitability — it can even be a warning sign.
We therefore always separate price leakage from cost-to-serve, into two distinct waterfalls: one for price (where pricing policy and governance are the answer) and one for margin after cost-to-serve (where the service model is the answer — minimum order quantities, delivery frequency, support tiers). That way you don't repair a price where the problem sits in the service, and you don't cut service where the problem sits in the price. That distinction protects precisely the customer relationships you want to keep — often exactly the customers an owner is emotionally attached to.
A European footnote: wide price bands are also a compliance question
For a company selling across the Benelux and more broadly across Europe, there is one more reason not to leave undocumented price differences lying around. Wide, unexplained price bands for the same product to comparable customers are not only a margin problem — within the European internal market they can also raise a competition-law question around discriminatory pricing. Price differences you can substantiate with volume, segment or cost-to-serve stand firm; differences you cannot explain stand weak both commercially and legally. Measuring against policy immediately gives you the substantiation that covers both sides.
Why this approach works for a growing industrial company
The instruments above — the waterfall, the dispersion measures, the profitability curve — are no Yggra invention. They have been common currency among pricing experts for decades.5 Our contribution is the translation to the reality of an owner-led industrial company, and the coherence: we bring them together in one method, Pricetainability™, and measure consistently against policy rather than against an average.
Three reasons why that works better for a mid-market company. First: you often have no pricing policy on paper yet. Measuring against an abstract average then imposes a foreign norm, whereas we first make your own logic explicit — you don't get a model forced on you; your own intent becomes visible for the first time. Second: the owner keeps control. We deliver the facts and separate what is objectively a leak from what is a choice; the strategic decisions — which customer you deliberately keep low, which relationship you protect — stay with you. That fits how a family business decides. Third: relationships stay discussable without being threatened, precisely because price and cost-to-serve sit on the table separately.
What you can already see for yourself
You don't have to wait for an audit to find the first traces. Part of this work is recognition, and you can do that today. Run your own company past these questions:
- Do two comparable customers pay markedly different prices for the same product, without your being able to name the reason?
- Is there a discount on an account that no one can quite remember the origin of?
- Is there a price that hasn't been touched since the last big cost increase — usually with a loyal customer?
- Are certain agreements corrected manually every time because they don't sit watertight in your system?
- Are there large customers you quietly suspect actually contribute little, given everything you do for them?
Every “yes” is a sign that something is there. And if you want to take one concrete step: take your ten largest products, and for each put the highest realised price next to the lowest of the past year. Not the average — the extremes. Wherever that gap is large and you cannot immediately explain it, you have a candidate.
But here lies the honest boundary, and it matters that you know it. What you find this way shows you that something is there — not how much, not what is explicable, and not what you should do about it. Going from “I see a pattern” to “this is the size, this is recoverable, this I repair and this I deliberately keep” is a different step. It calls for the full reconstruction per order line, for normalisation against legitimate differences, and for thresholds tuned to your sector and data structure. That is the diagnosis: the point where recognising turns into quantifying.
Margin leakage is, in the end, no accounting detail. It is the difference between the company you think you run and the company your invoices describe. Making that difference visible is the first step — and that one you can take yourself today. Knowing how large it is and what to do about it is the next.
Recognise a few of these signals and want to know what it really means in your case?
Schedule a complimentary call →- Marn, M. V. & Rosiello, R. L., “Managing Price, Gaining Profit,” Harvard Business Review, Sept.–Oct. 1992. Introduction of the pocket price waterfall and the price–profit leverage (~11% operating profit per 1% price). ↩
- Simon-Kucher & Partners, Global Pricing Study 2019 (n ≈ 1,650 companies). Average price realisation ~28% of planned increases. ↩
- Nagle, Müller & Gruyaert, The Strategy and Tactics of Pricing, 7th ed., Routledge 2023 (pricing-policy layer); Revology Analytics and Ibbaka on separating explainable from unexplained price dispersion (“explain and defend”). ↩
- Kaplan, R. S. & Narayanan, V. G., “Measuring and Managing Customer Profitability,” Journal of Cost Management, 2001; Kanthal case (HBS, 1989). ↩
- Bain & Company (Kermisch & Burns) on invisible post-sale leakage; BCG, “Beyond the Black Box in Pricing” (2021), which for lower-maturity companies typically identifies 400–800 basis points of margin potential; Frenzen et al. (2010) on price-authority delegation. ↩
- Marn & Rosiello (1992); tier and volume discounts as legitimate structural pricing policy, to be distinguished from discretionary exception discounts. ↩
Wondering where your profit margin is slipping away? Start with a diagnosis.
Request a Pricing Audit →