The top 20% of your customers generate between 150 and 300% of your net profit. The bottom 10% destroys 50 to 80% of the potential. The middle 60% break even. Pareto applies to revenue — not to profit.
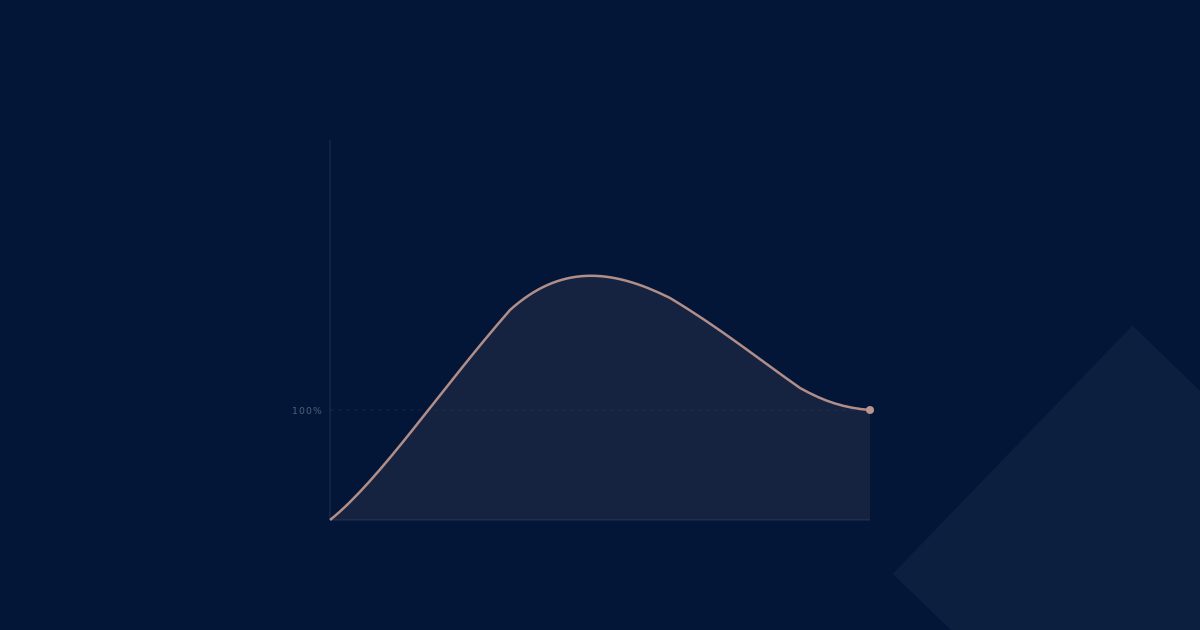
Anyone who ranks customers by cumulative profitability instead of revenue gets a chart that looks like the back of a whale: steep climb, plateau in the middle, sharp drop at the end. Hence the name. And the message is brutal: in nearly every industrial B2B portfolio, there are customers that actively destroy margin — while you treat them as valuable accounts because they bring large revenue.
This article shows what the whale curve is, why Pareto's 80/20 rule no longer applies here, and how to build it on your own data — without pricing software.
Key takeaways
- Pareto applies to revenue, not to profit. On customer profitability, the actual pattern is more dramatic: 20-60-20 with extremes.
- Top 20% generates 150 to 300% of net profit. Bottom 20% destroys 50 to 80%. Middle 60% is break-even.
- The whale curve was documented by Harvard professors Kaplan and Narayanan based on hundreds of Activity-Based Costing studies.
- Largest customers usually sit at the extremes — extremely profitable or structurally loss-making. Rarely in the middle.
- Building it requires only simple cost allocation — no full ABC implementation needed to make the pattern visible.
Why Pareto fails on customer profitability
The 80/20 rule — 80% of revenue comes from 20% of customers — is statistically valid and strategically useless. It tells you something about revenue, not about profit. And as every CFO knows: revenue is opinion, profit is fact.
Harvard professors Robert Kaplan (co-inventor of Activity-Based Costing) and V.G. Narayanan researched customer profitability in hundreds of organizations. Their finding: the Pareto distribution does not hold for profitability. The actual pattern is fundamentally different.
In a typical industrial B2B portfolio:
- The most profitable 20% of customers generate 150 to 300% of the company's net profit.
- The middle 60 to 70% are net break-even — they produce revenue but contribute nothing net after cost-to-serve.
- The least profitable 10 to 20% destroy 50 to 200% of potential profit.
Final 100% net profit is therefore the resultant of a large positive sum (top), a neutral sum (middle), and a large negative sum (bottom). Removing the bottom — without changing anything else — would lift net profit. Often by 30 to 50%.
"Ask a leadership team without data: 'which customers are loss-making?' The guesses are usually reasonable. Except for the top-3 largest customers — those are consistently placed in 'profitable' when in reality they often sit at the extremes."
Why large customers sit at the extremes
A counter-intuitive but consistently observed truth: your largest customers rarely sit in the middle of the whale curve. They are either your most profitable, or your most loss-making. Three reasons:
1. Large customers receive the largest discounts. Volume rebates, contract discounts, payment-term concessions — anything large gets a lot.
2. Large customers generate the highest cost-to-serve. Special delivery requirements, dedicated account management, custom configurations, customer-specific quality controls, extended payment terms.
3. The combination is asymmetric. When a large customer also pays high margins and is standardized, they are extremely profitable. When the same large customer pays low margins and has high cost-to-serve, they suddenly become one of your largest loss positions.
The problem: in most mid-market businesses, cost-to-serve is not allocated at customer level. So large customers always look "good" on the report — because only revenue and standard COGS are charged. The whale curve makes this blindness visible.
Building the whale curve on your own data
You do not need a full ABC implementation to get usable insights. A simple six-step approach:
Step 1 — Select your top 50 customers by revenue. That is usually 70 to 80% of your commercial activity. The rest can be added later.
Step 2 — Determine Net Revenue per customer. Gross revenue minus all on- and off-invoice deductions. For off-invoice items not booked per customer: distribute pro-rata on gross revenue. Imperfect, but sufficient for the pattern.
Step 3 — Determine direct COGS per customer. Standard COGS from your ERP. Nothing complex needed.
Step 4 — Add cost-to-serve through reasonable allocation. Important buckets: account management time, logistics, technical support, customer-specific development, return processing. For each bucket: determine total annual cost and allocate to customers based on a driver (number of orders, items, support calls). Not perfect — directionally correct.
Step 5 — Calculate net profit per customer. Net Revenue minus COGS minus cost-to-serve = customer profitability.
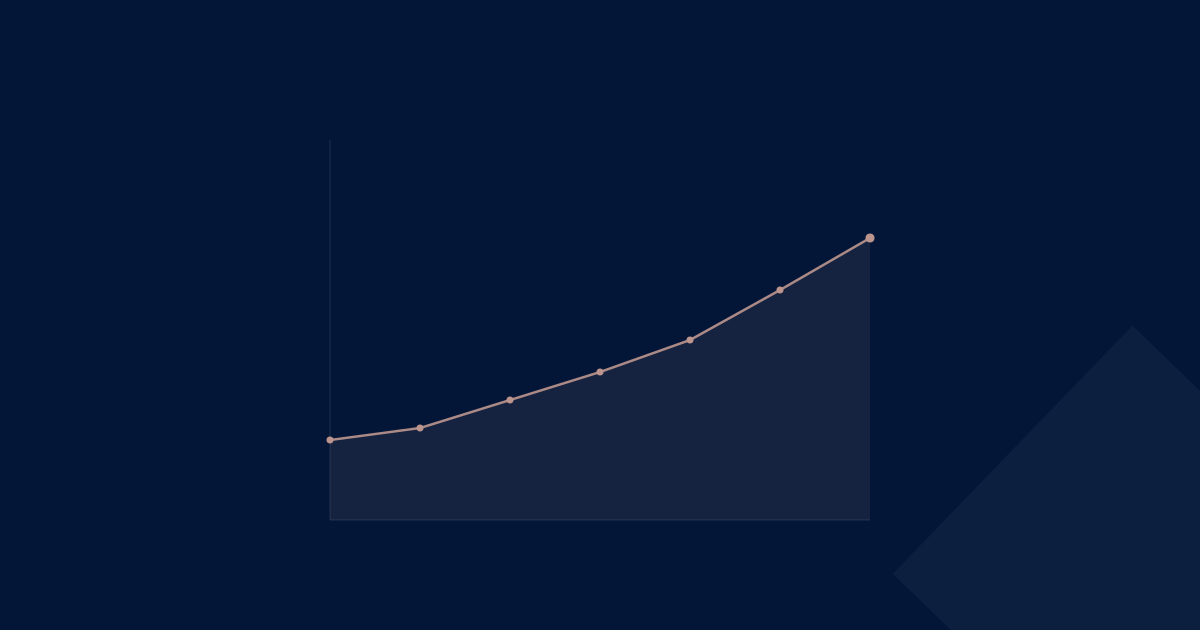
Step 6 — Plot cumulatively, ranked by profitability. X-axis: customers ranked from most to least profitable. Y-axis: cumulative profit. The resulting curve is your whale.
In practice, this delivers a first workable chart on your own ERP data within 4 to 6 weeks. No integration project, no migration. A chart that completely reframes the strategic conversation.
What you do with the whale
The whale curve is not an action instrument in itself. It is a diagnostic instrument that triggers three types of action:
For the top 20% — strengthen and replicate. What makes these customers profitable? Which segment, which buying behavior, which product mix? Which sales reps own these accounts? Identify the pattern and build your commercial strategy around it — not around "we want more revenue."
For the middle 60% — lift or accept. Which break-even customers can you move toward profitable? Often through price correction, better product mix, or lowering cost-to-serve (shorter payment terms, limiting customer-specific exceptions). What is not movable, treat as capacity decision.
For the bottom 10 to 20% — recover, restructure, or part ways. Three options: raise price (and accept that some customers walk), drastically reduce cost-to-serve (no exceptions, no specials), or end the customer relationship. There is no fourth option. Continuing as is is a choice to actively keep destroying margin.
"The hardest conversations in any pricing diagnostic always concern the bottom of the whale curve. It is psychologically difficult to say: 'this customer costs us money.' It is operationally even harder to do something about it. But the whale curve is unforgiving: continuing as is is an active choice."
Bottom line
The whale curve is not exotic analysis. It does not require pricing software, external consultancy, or ERP recoding. It requires — like the rest of pricing — primarily the willingness to read your own data honestly.
Businesses that update their whale curve once a year and translate it into commercial policy demonstrably outperform businesses that "intuitively know" which customers are difficult. That is not opinion. That is measurement versus intuition.
In the Pricetainability™ framework, the whale curve belongs in Truth: facts about your actual customer portfolio, before you make policy or try to improve execution.
Wondering where your profit margin is slipping away? Start with a diagnosis.
Request a Pricing Audit →